Digital Marketing, Digital Production
The Power of Visual Storytelling in Healthcare Marketing: Why Infographics Matter
Igor Vianna - Our Managing Director

As healthcare becomes increasingly complex, the need for clear, engaging communication has never been more crucial. At C/Edge, we understand that healthcare marketing requires a delicate balance between scientific accuracy and accessibility. This is where infographics and scientific illustrations prove their worth as invaluable tools in your marketing a senal.
The Brain’s Visual Preference
The human brain is inherently wired for visual processing. Research shows that 90% of information transmitted to the brain is visual 1, and people retain 65% of information when it’s paired with relevant images, compared to just 10% when hearing it alone 2. For healthcare professionals and patients alike, this visual processing capability is a gateway to better understanding and engagement.
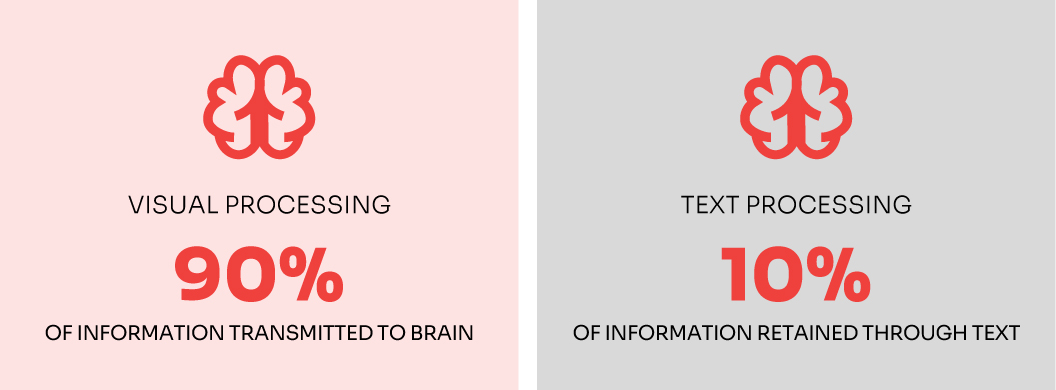
Visual information comprises 90% of brain processing while text processing accounts for only 10%, demonstrating the brain’s strong
preference for visual content. 1
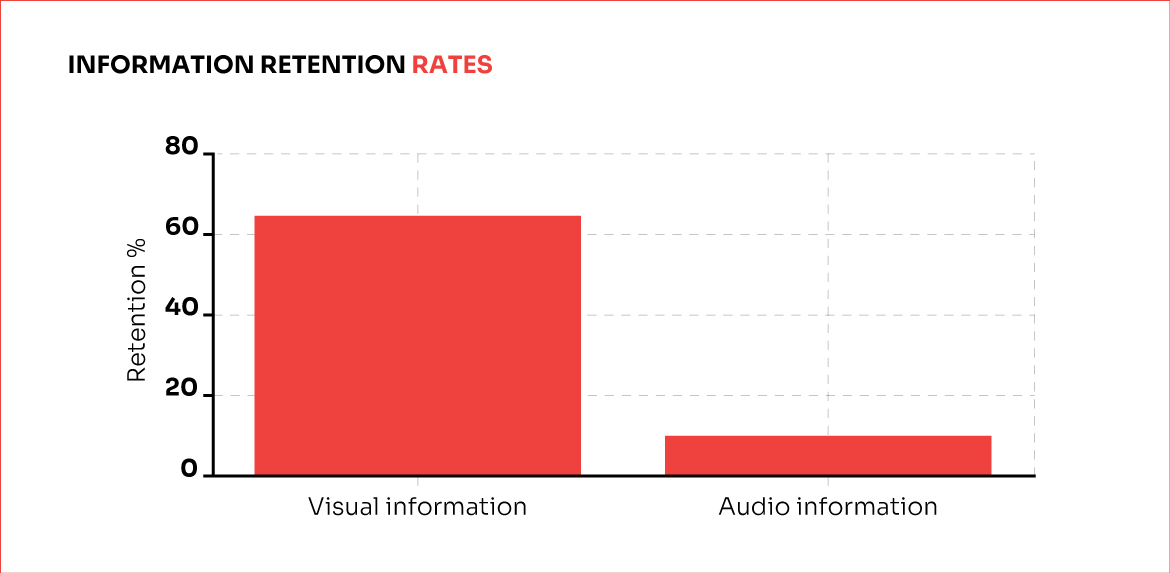
Information retention rates show a stark contrast between visual and audio learning, with visual information being retained at 65%
compared to only 10% for audio information, highlighting the significant advantage of visual-based communication methods 2
Why Healthcare Needs Visual Content
Healthcare concepts, treatment protocols, and medical procedures often involve complex information that can be challenging to convey through text alone. The data speaks volumes about the effectiveness of visual communication in healthcare settings.
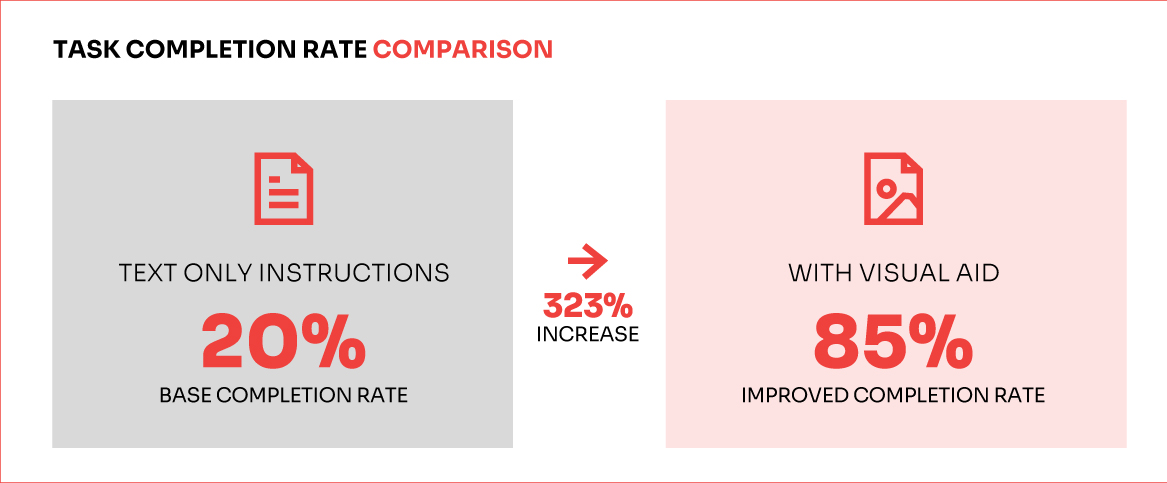
Using visual elements to instruct the public increasesthe likelihood of a instruction being understood and followed in more than
300%. 3
When instructions include visual elements, readers are 323% more likely to successfully complete the described actions3. In healthcare, this dramatic improvement can mean the difference between proper and improper medication adherence, correct device usage, or successful patient self-care procedures.
The Impact on Digital Engagement
The numbers tell a compelling story about the power of visual content in the digital space. Web content incorporating visuals receives 80% more engagement than text-only content 4, while articles with images receive 12% more views 5. For healthcare organizations, this translates to better information retention and improved patient education outcomes.

Visual content metrics reveal significant performance improvements across key indicators, with engagement showing an 80% boost,
persuasiveness increasing by 43%, and overall traffic rising by 12%, demonstrating the comprehensive impact of visual-based
communication strategies.
The C/Edge Advantage
At C/Edge, we’ve refined our approach to creating healthcare infographics that serve both marketing objectives and educational purposes. Our expertise lies in transforming complex medical information into clear, engaging visual narratives that resonate with both healthcare professionals and patients.
The Future of Healthcare Communication
As healthcare continues to evolve, the role of visual communication becomes increasingly vital. With 56% of marketers now using visuals in all their marketing content 6, healthcare organizations that don’t embrace this trend risk falling behind.
Ready to Transform Your Healthcare Marketing?
At C/Edge, we’re committed to helping healthcare organizations harness the power of visual storytelling. Let’s create compelling visual narratives that drive engagement, understanding, and better health outcomes. Contact us today at Contact Us or read other articles in our website wearecedge.com/articles to learn how we can help you leverage the power of visual content in your healthcare marketing strategy.
References
[1] Infographic World: “90% of the information transmitted to the brain is visual”
[2] Helbing, Jason & Draschkow, Dejan & Võ, Melissa. (2020). Search Superiority: Goal-Directed Attentional Allocation Creates More Reliable Incidental Identity and Location Memory Than Explicit Encoding in NaturalisticVirtual Environments. ResearchGate.Cognition.196. 104147. 10.1016/j.cognition.2019.104147. : “People remember 65% of visual information vs 10% of heard information”
[3] Springer: “323% more likely to complete action with visual directions”
[4] Webdam: “650% more engagement with visual content”
[5] Jeff Bullas: “Web articles with images receive 94% more views”
[6] Social Media Today: “56% of marketers use visuals in all of their marketing content”
Note: The C/Edge Design Team created all visualizations in this article using our proprietary healthcare-focused design system.
